Years ago, I was meeting with a client to discuss his need for an energy-savings effort in his facility. Just as our meeting started, an administrative assistant came in with checks in need of the client’s signature. I asked the client the approximate amount of his energy bill each month. He did not know—he had just signed a check for tens of thousands of dollars for facility utilities without looking at the amount! While that may seem extreme, I believe it to be more common than people think. In this case, after careful analysis, we discovered the client's energy costs had increased 40 percent over the previous five years. Many facility managers are so preoccupied with day-to-day problems that they do not recognize the long-term energy-usage patterns of their facility. This article discusses ways to analyze facility energy usage.
How Your Facility Stacks Up
A common measurement of facility energy usage is energy utilization index (EUI). To calculate EUI, take the amount of energy consumed, in thousands of British thermal units, and divide by the gross conditioned area, in square feet. The higher the EUI, the less efficient the structure. When comparing facilities, be sure they are functionally similar—for instance, do not compare a hospital to a school. Keep in mind that EUI is a general measurement, and many factors, such as location and weather, play a large role. Many facility managers add degree-days—in general, the amount of variation between an average daily temperature and a base temperature, usually 65°F—to basic EUI measurements. In such cases, EUI is expressed in thousands of British thermal units per square foot per degree-day. Both heating and cooling degree-days can be used.
Another common measurement is Energy Cost Index (ECI). To calculate ECI, take utility expenditures, in dollars, and divide by gross conditioned area, in square feet. As with EUI, ECI can be used to compare similar facilities. Keep in mind that energy costs vary by geographical region.
EUI and ECI can be used together or separately to get an objective ranking of the energy usage and associated costs of a facility.
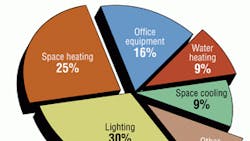
Energy Usage by Equipment Type
The next step is to identify the energy used by the mechanical system. For most facilities, that includes heating, cooling, and lighting. Some facilities could have another category, such as an industrial process, that needs to be evaluated as well.
Heating systems. Many facilities use steam or hot-water boilers for heating. These boilers can be metered individually to determine their natural-gas or fuel-oil consumption. Today's utility meters, which can be integrated into a building's Ethernet network, provide extensive information regarding time, date, and amount of energy use. Additionally, boiler nameplate data can be recorded and used for energy-efficiency comparisons.
Cooling systems. In the facilities of most of my customers, chillers are the largest consumers of energy, often accounting for 50 to 70 percent of total electricity costs. Here again, individual monitoring of equipment is important.
Newer chiller equipment commonly uses half of the energy of older equipment. This should be considered in chiller sequencing and the development of rotation schemes.
Most newer pieces of equipment have a microprocessor control panel that provides real-time energy monitoring.
Plant auxiliaries—cooling towers, water pumps, air-handling units—account for roughly 10 to 30 percent of total plant energy consumption and, thus, cannot be ignored. Most plant auxiliaries have variable-speed drives that can supply energy data.
Some facilities use smaller packaged HVAC systems, such as rooftop units. In general, these do not provide the sophisticated control and monitoring schemes of large central chiller plants. They can be evaluated using manufacturer-supplied literature or field measurements taken with a digital multimeter/ammeter.
Lighting. Lighting is estimated to account for 20 to 30 percent of energy use. Lighting circuits can be checked using permanently installed meters or portable test equipment.
Upon discovering that lighting accounted for a high percentage of his production facility’s energy use, a client of mine switched to a new high-intensity lighting system. This lowered summer cooling demand by approximately 100 tons. Previously, at peak outside-temperature and humidity conditions, the facility needed three chillers in operation. After the switch, it mostly needed two. This saved a large amount of energy and money and provided a short payback.
Use of Test Instruments
Once an energy profile is created for a facility, test instruments can be used to identify areas of energy waste and energy loss. These instruments include infrared (IR) thermometers and digital multimeters (DMMs).
Infrared thermometer. An IR thermometer can be used during a walkthrough of a facility to identify sources of energy waste, such as:
- Insulation. An IR thermometer can be used to identify insufficient insulation. Insulation repair should be considered for any pipe or duct surface above 140°F.
- Steam-trap failure. An IR thermometer can be used to find failed steam traps. One repaired steam trap will pay for a thermometer.
- Heat losses. An IR thermometer can be used to identify heat that is being lost through doors, windows, and other building openings.
- Stack losses. Along with other instruments, such as a combustion analyzer, an IR thermometer can be used to identify abnormal amounts of heat leaving the stack of a natural-gas or oil-fired boiler system.
Digital multimeter. A true-root-mean-square (RMS) DMM can be used with a current clamp attachment to measure volt amperage or kilovolt amperage and estimate the power used by a piece of equipment or lighting circuit. A DMM is especially useful with smaller equipment, such as rooftop units. Some true-RMS meters can be connected to a personal computer, allowing data to be stored for future analysis.
Conclusion
The methods above are a good start to understanding the energy patterns of your facility. They can help show a "path" of energy coming into the building and being consumed by building systems. This data can be used to determine energy-saving strategies and estimate payback.
Ron Auvil is a senior instructional consultant specializing in staff- and workforce-performance issues for a major HVAC/controls manufacturer. An author and curriculum developer, he has worked with some of the world's largest and most quality-conscious companies, providing custom training on improving the operation of environmental systems. His clients have included NASA, the Pentagon, and the University of South Carolina.
Did you find this article useful? Send comments and suggestions to Executive Editor Scott Arnold at [email protected].