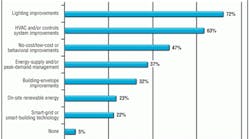
Executives who are responsible for energy management identify smart-building technology as one of the clean-energy technologies they expect to experience the greatest increase in market adoption over the next 10 years. However, just 22 percent of the same executives report that their organization has adopted smart-grid or smart-building technologies in the last 12 months.
Those are among the findings of the 2011 Energy Efficiency Indicator (EEI) survey. Administered by the Johnson Controls Institute for Building Efficiency in partnership with the International Facility Management Association, the Urban Land Institute, and 30 strategic partners around the world, the fifth annual survey polled global executives and building owners responsible for energy management and investment decisions in commercial and public-sector buildings. The survey tracked their priorities, practices, investment plans, and financial evaluation criteria to understand the projects they are implementing, the drivers of action, and the barriers they face.
In 2011, the survey had a record number of respondents: nearly 4,000, representing 24 industry sectors in 13 countries on six continents.
Companies that participated in the EEI survey invested in a variety of smart-building technologies over the past year, including:
- Data systems providing access to electrical metering information, 13 percent.
- Controls programmed for an automated response to signals from utilities, 9 percent.
- Integration of facility systems with other internal software applications, 8 percent.
- Software user interfaces showing price or event information from the utility or grid operator, 8 percent.
- Integration of facility systems with outside data sources, such as weather, 7 percent.
Putting the Data to Use
Survey results indicate organizations that have implemented smart-grid or smart-building technologies are 2.5 times more likely to review data frequently than those that have not. However, the survey also shows that although 43 percent of participants reported they measure and record energy data at least weekly, only 15 percent actually review and analyze that data with the same frequency. Forty-three percent review it monthly (most likely when their utility bills arrive), and another 37 percent admit to reviewing it quarterly or less.
This apparent disparity between the number of organizations that collect data frequently and those that analyze it frequently could be explained by the lack of automated analysis. Until recently, reviewing and analyzing that data has been a human function, requiring someone with the time and analytical skills to identify operating abnormalities, energy inefficiencies, and opportunities for improved building performance. Unfortunately, these operators are few in number and have job responsibilities that leave them little time to perform an analysis that produces actionable information.
As a result, many buildings today underperform—even those that have implemented smart-grid or smart-building technologies. To gain full advantage of data that are collected and stored by smart technology, information must be reviewed and analyzed frequently. It is only through frequent analysis and review of operating data that situations affecting building performance can be detected and corrected.
Fortunately, smart-building technology increasingly enables automatic collection and analysis of data. As a result, organizations that collect data frequently can review it frequently as well.
Many buildings today employ energy-supply and/or peak-demand-management systems, including those adopted by 37 percent of the survey’s respondents. The U.S. Federal Energy Regulatory Commission defines demand-response as changes in electric usage by end-use customers from their normal consumption patterns in response to changes in the price of electricity over time or in response to incentive payments designed to induce lower electricity use at times of high wholesale market prices or when system reliability is jeopardized. In essence, demand response allows electricity users—in exchange for financial incentives—to reduce electricity use during times when the grid needs help.
Demand response represents just one example of how smart technology can convert data into actionable information, the result of a continuum in which data are collected, integrated, and analyzed in the context of an entire building, providing insights that lead to automated actions to counteract problems or further optimize building performance. Smart buildings respond to messages from utilities indicating an increase in electricity prices, and action begins. For example, ice made earlier in the day can begin to melt, offsetting energy used by a chiller to provide air conditioning, and common-area lighting can be dimmed. As electricity prices continue to increase throughout the day, the building can take more aggressive actions to reduce demand, including letting temperatures drift within limits, throttling down data-center servers that are performing noncritical work, and sending e-mails instructing employees to unplug laptops, removing them from the building’s electric grid. These and other actions benefit both the building owner by lowering energy costs and the utility by decreasing demands on the grid.
Page 2 of 2
Barriers to Energy-Efficiency Measures
Despite the success of peak-demand management and other energy-efficiency measures, many executives in the survey reported significant barriers to energy-efficiency investments, ranging from organizational structure to technical capacity and financial considerations. The relative importance of the barriers varied, depending on the organization and regions of the world where respondents operated. However, the survey identified the top five barriers to energy investments:
- Lack of funding, identified by 30 percent of respondents.
- Inability of projects to meet the organization’s financial payback criteria, 19 percent.
- Lack of certainty that promised savings will be achieved, 12 percent.
- Lack of technical expertise to design and complete projects, 9 percent.
- Lack of awareness of opportunities for energy savings, 9 percent.
The 30 percent of respondents who identified lack of available capital as the biggest barrier to energy investments also identified additional financial barriers, including an insufficient internal capital budget, insufficient government or utility incentives, difficulty obtaining external financing at attractive rates and terms, difficulty identifying appropriate financing options, balance- sheet debt limitations, and the inability to secure external financing.
Fortunately, leaders in the energy-services sector are developing solutions to many of these barriers through both technological and financial innovations. Smart technologies are evolving and increasingly can take action on an automated basis to ensure that savings projections are met.
On the financial front, property-assessed clean-energy financing and other financial mechanisms are allowing more organizations to reduce upfront cash requirements and finance project costs over a longer period of time. Alternative models include power-purchase agreements, energy-performance contracting, utility on-bill financing, and energy-service agreements. These financing models make it possible for businesses to update their facilities with energy-efficient and cost-cutting technologies while paying for the upfront capital expenditure through energy savings.
Despite the barriers before them, organizations are taking advantage of technological and financial innovations. Last year, the respondents pursued an average of 8.9 energy-efficiency-improvement measures. Lighting improvements led the list, with 72 percent of the executives surveyed reporting that their companies have made lighting improvements. Sixty-one percent switched to energy-efficient bulbs, lamps, ballasts, or fixtures, and 39 percent installed occupancy or photo sensors.
HVAC and/or controls improvements followed, with 63 percent of organizations investing in HVAC-related measures. The wide range of energy-efficiency projects includes:
- Increasing awareness of facility occupants to reduce energy use, 37 percent.
- Replacing inefficient equipment before the end of its useful life, 36 percent.
- Upgrading or improving an existing building-management system, 29 percent.
Shared Attributes and Priorities
A wide variation in performance exists between otherwise comparable organizations when it comes to energy improvements adopted. The survey revealed a set of four attributes shared by the organizations leading the way in clean-energy implementation. These attributes provide clues as to how decision makers may be overcoming key barriers to energy-efficiency investments. According to the survey, organizations that implemented more projects:
- Establish energy or carbon-reduction goals (true of 76 percent of survey respondents).
- Measure and analyze energy-usage data more frequently than monthly (58 percent).
- Add resources through hiring, repurposing, or retraining of staff or seek external support from consultants or other service providers (54 percent).
- Use external financing sources for projects (58 percent).
Organizations that exhibit all four of the above attributes were found to implement 13.2 measures, or four times as many improvement measures as those that did not exhibit any of these organizational characteristics.
Energy efficiency continues to be a strong priority for organizations around the world. In every market, the EEI survey showed an unmistakable growth in interest in energy efficiency, with 70 percent of those surveyed identifying energy efficiency as "very important" or "extremely important" to their organizations. That represents a 10-percent increase since last year’s survey.
Driving the interest in energy efficiency are energy-cost savings, government and utility incentives and rebates, and enhanced brand or public image. Carrying that interest forward are new and evolving technologies that will enable connectivity between all of the equipment and systems in a building, collecting and merging data into a common platform for automated analysis and reporting so executives can quickly assess the information and better make decisions that impact the profitability, comfort, and sustainability of their facilities.
For more information about the EEI survey, write to [email protected].
Clay Nesler is vice president, global energy and sustainability, for the Building Efficiency business of Johnson Controls. He is responsible for energy and sustainability strategy, policy, innovation, and nongovernmental organization relationships, as well as the Johnson Controls Institute for Building Efficiency. He also serves on the company’s global environmental sustainability council. Since joining Johnson Controls in 1983, he has held a variety of senior leadership positions in research, product development, marketing, consulting, and strategy in both the United States and Europe.


