PSMJ: Recovery in Full Swing as AEC Proposal Activity Surges
PRESS RELEASE
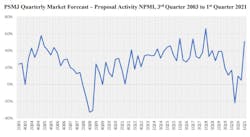
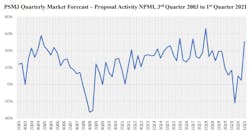
NEWTON, MA, May 7, 2021 – Proposal activity for architecture, engineering and construction (A/E/C) firms improved for all markets and nearly all submarkets in the 1st Quarter of 2021, with overall Net Plus/Minus Index (NPMI) rising from 5% in the 4th Quarter of 2020 to a near-record 51%, according to industry advisor PSMJ Resources Inc.
“It’s time to party like it’s 2019,” says PSMJ Senior Principal David Burstein, P.E., AECPM. “For the first time since the pandemic began, proposal activity in all major market sectors is increasing. Even sectors that had been slow prior to the pandemic, such as education, are now picking up steam. There are still a few submarkets that haven’t fully recovered – office buildings, petroleum facilities and chemical plants, for example – but the overall picture looks very bright.”
PSMJ’s NPMI expresses the difference between the percentage of firms reporting an increase in proposal activity and those reporting a decrease. The QMF has proven to be a solid predictor of construction market health for the A/E/C industry since its inception in 2003. Among other financial indicators tracked by the survey, the NPMI for 1 st Quarter revenue increased from -5% to 17%, anticipated revenue for the 2nd Quarter increased from 16% to 49%, and backlog climbed from 0% to 26%.
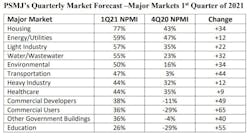
The Housing market once again led all 12 major markets with an NPMI of 77%. Not a single survey participant reported declining proposal activity in the Housing market, while 23% said it stayed about the same. Multifamily (NPMI of 71%) and Single-Family Subdivisions (68%) led among submarkets.
“The Housing Subdivision market, a good bellwether for long-term trends in the A/E/C industry, is up substantially,” adds Burstein. “In fact, our NPMI showed the highest growth we’ve ever recorded for that submarket. This impressive showing follows two prior quarters of strong proposal activity. And this is without any of the federal infrastructure funding now being considered by Congress. So the focus of the A/E/C industry is moving from finding enough work to finding enough people to do the work.”
Energy/Utilities was the major market runner-up with a 59% NPMI, bolstered by the submarket-best 73% for Renewable Energy. Rounding out the Top 6, Light Industrial was third at 57% on the strength of outstanding numbers for warehouse/distribution facilities (72%), Water/Wastewater recovered from an unexpected slide in the 4th Quarter to take fourth place at 55% (up from 23%), while the Environmental market grabbed fifth (50%, up from 16%) and Transportation (47%, up from 3%) was sixth.
Education was once again the weakest of the major markets, though it climbed 55 NPMI percentage points to a positive 26%. The NPMI for Education was negative for all four quarters of 2020. Commercial Users (36%, up from -29%) and Government Buildings (up from -4%) tied for 10th, while Commercial Developers (38%, up from -11%), Healthcare (44% up from 35%) and Heavy Industry (44% up from 32%) complete the bottom half of the list.
The 1st Quarter results tell the story of a remarkable comeback. For the 2nd Quarter of 2020, only 4 of the 12 major markets reported a positive NPMI, with Water/Wastewater, at 20% NPMI, leading all major markets. Among the 58 submarkets, positive NPMIs tripled – from only 16 in 2Q20 to 48 in 1Q21.
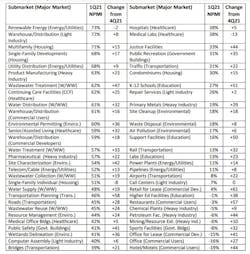
Even struggling markets such as Restaurants (up 57 NPMI percentage points to -3%), Retail for Lease (up 61 to 4%), K-12 Facilities (up 51 to 27%) and Hotels/Motels (up 44 to -19%) showed major gains. Other outstanding submarket results include Utilities Distribution (NPMI of 68%), Product Manufacturing (63%), Continuing Care Facilities (62%), Wastewater Treatment (62%), Water Distribution (61%) and Environmental Permitting (60%).
See below for the results for all 58 submarkets. PSMJ has been using the QMF as a measure of the design and construction industry’s health every quarter for the past 17 years, assessing the results overall and across 12 major markets and 58 submarkets. The company chose proposal activity because it represents one of the earliest stages of the project lifecycle. A consistent group of over 300 firm leaders responds each quarter, including 183 for the most recent quarter.
For more information or to receive a copy of the full 53-page report, contact Jerry Guerra at [email protected].
About PSMJ
For more than 40 years, PSMJ Resources, Inc. has been recognized as the leading publishing, executive education, and advisory group devoted completely to improving the business performance of A/E/C organizations worldwide. http://www.psmj.com.


