CFD Analysis of Air-Curtain Effectiveness
By JIM JAGERS, Air Movement and Control Association (AMCA) International Air Curtain Engineering Committee
Computational fluid dynamics (CFD) is the use of computer modeling to predict and/or analyze fluid-flow phenomena. Importantly, CFD analysis can be performed during the design phase of a project to determine if equipment will operate as expected. With respect to HVAC, CFD can be used in both equipment design and building-system design to predict airflow patterns and temperature gradients with a great deal of certainty.
This article discusses the use of CFD to demonstrate the effectiveness of an unheated air curtain in reducing energy transfer across an opening in a building.
The building in our model measured 120 ft by 120 ft by 20 ft. On the right side of the building was an opening measuring 16 ft high by 12 ft wide. Inside the building, on the left, was a heating unit enabling adjustment of heat input into, and recirculation of air within, the building. Over the opening was an unheated air curtain. The air curtain took in air and blew it across the opening from top to bottom. As is normal for this type of application, the nozzle of the air curtain was directed slightly toward the building’s exterior to combat wind effect at the opening. The exterior temperature was a constant -6°F with no wind. With regard to heat loss, a no-wind condition is the worst case with an air curtain operating, as there is no wind to push the air curtain’s air stream back toward the opening.
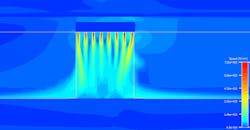
The air curtain had eight centrifugal fans blowing through the 4-in.-wide nozzle, which was the length of the 16-ft-long air curtain. Figure 1 clearly demonstrates the velocity profile across the opening and air wash across the floor.
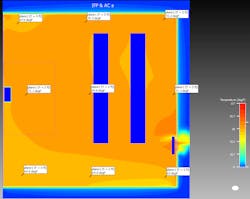
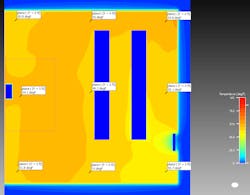
The air curtain was turned on and heat was added until the interior temperature stabilized at an average of approximately 68°F at 5 ft above the floor. The required heat-input rate was 2.5 million Btuh; with wind, it might actually have been less. The blue objects in Figure 2 are racks modeled as porous objects that played no significant part in the modeling.
Of particular significance in Figure 2 are the 7.6°F maximum temperature difference within the building, the 117°F maximum temperature within the space as shown in the scale, and the exterior of the opening. Clearly, some heat is moving across the opening. This is due in great part to the air-curtain nozzle being directed toward the exterior of the building.
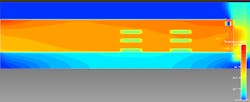
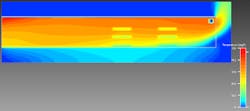
In Figure 3, one can see no cold air is infiltrating the building and the air curtain is blowing heated air through the opening. The temperature variation from floor to ceiling is about 1°F per foot of elevation.
In the next iteration of the model, the heat-input rate was maintained at 2.5 million Btuh, the air curtain was turned off, and building temperature was allowed to stabilize (Figure 4).
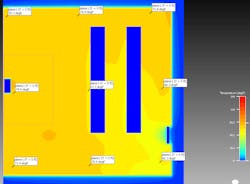
Of note in Figure 4 is that the average temperature 5 ft above the floor dropped to approximately 51°F. The maximum temperature in the scale is attributable to the lower room temperature. Also, it is clear cold air is entering at the opening.
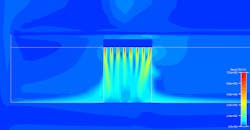
Figure 5 is a vertical temperature profile with the air curtain turned off. Note that as warm air rolled out of the top of the opening, cold air entered the lower half of the opening and moved across the floor. The cold air infiltrated the building to the second rack from the door. The temperature varied about 2°F per foot of elevation.
The final step in the evaluation was to determine the fuel-input rate required to return the average room temperature to 68°F. In Figure 6, the average building temperature is about 70°F, which an additional 1.25 million Btuh was needed to attain.
In comparing Figure 6 to Figure 2, most striking are the maximum temperature, which is now 144°F, and the temperature variation. Among the nine measured points, the greatest difference is 14.6°F. However, the difference between just inside the opening and the warmest measured point is much closer to 65°F.
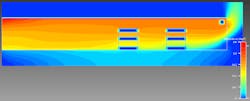
Figure 7 reinforces what is seen in Figure 5: heat rollout at the top of the door and infiltration of cold air along the floor. What is difficult to see is the extent of cold-air infiltration. Cold air now extends past the second shelving rack and is nearly two-thirds of the way across the building. The floor-to-ceiling temperature variation appears to be more than 2°F per foot of elevation.
Conclusion
CFD is a powerful tool allowing HVACR engineers to determine with a high degree of certainty temperature gradients and airflow patterns within a building envelope. The velocity profile in Figure 1 shows the curtain of air that separates the building environment from the outside. Figures 2 and 3 display the base model for the simulations. Figures 4-7 show model results with the air curtain turned off and different heat-input rates.
This CFD model demonstrates the effectiveness of an air curtain in saving energy. The air curtain saved energy by minimizing heat transfer across the building opening. The energy saved with the door open was about one-third of the total energy needed to maintain the building at an average temperature of 70°F. Additionally, the temperature variation within the building was more consistent with the air curtain than without it.
Through the combination of temperature bin data and the CFD analysis, expected annual energy savings can be quantified, while a full economic analysis can show simple payback, internal rate of return, and net present value over the life cycle of the air curtain.
For more information about air curtains, which are allowed as an alternative to vestibules in ANSI/ASHRAE/IES 90.1-2019, Energy Standard for Buildings Except Low-Rise Residential Buildings,1 see the article “Air Curtains: A Proven Energy-Saving Alternative.”2
References
1) New ASHRAE standard will allow air curtains as vestibule substitutes. (2019, July 30). HPAC Engineering. Available at https://www.hpac.com/around-web/new-ashrae-standard-will-allow-air-curtains-vestibule-substitutes
2) Johnson, D. (2019). Air curtains: A proven energy-saving alternative. AMCA inmotion, pp. 14-20. Available at https://www.amca.org/educate/inmotion/amca-inmotion-magazine-2019.html
Based in Dallas TX, author Jim Jagers has 36 years of experience in the HVAC business as an engineering manager, a technical-services manager, and now a national sales manager. He is the holder of a U.S. patent for a special heater-control system and a Canadian patent for a gas-burner design.
