VFD-Enclosure Variable Cooling Load, Part 2 of 2


VFD-Enclosure Cooling-Load-Parameter Monitoring (continued from Part 1)
Figure 2 shows multiple parameters related to VFD Enclosure 1 measured over the course of a day. Readings were taken every 30 min. The x-axis depicts relative total VFD-enclosure cooling load, which represents the ratio of current enclosure load to design enclosure load at 100-percent VFD speed and 90-kW VFD output power demand. The top graph in Figure 2 shows VFD-enclosure total cooling load (including sensible- and latent-cooling-load components), as well as sensible-cooling load only. Relative total daily cooling load varied from 23 percent to 100 percent, averaging 48 percent, while the relative humidity entering the enclosure varied from 32 percent to 47 percent, averaging 43.7 percent. VFD-enclosure sensible-cooling load was calculated from the monitoring of the temperature and temperature differential (shown in the bottom graph in Figure 2) of cooling air exiting and entering the enclosure. VFD-enclosure total cooling load was determined based on the calculation of the enthalpy of exiting and entering cooling air from the monitored magnitudes of entering and exiting cooling-air relative humidity (shown in the second graph from the top in Figure 2) and coinciding entering and exiting VFD-enclosure air temperatures. The top graph in Figure 2 shows the maximum VFD-enclosure total cooling load (28,477 Btuh) was 48.8-percent higher than the coinciding maximum sensible-cooling load (19,142 Btuh). The average total VFD-enclosure cooling load (13,695 Btuh), meanwhile, was 17.3-percent higher than the average sensible daily VFD-enclosure cooling load (11,675 Btuh).
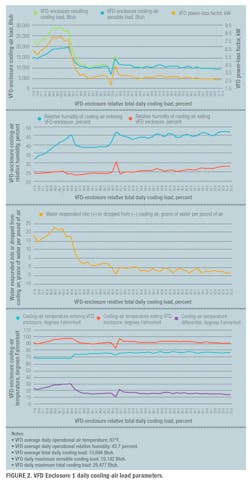
If the cooling-air exiting humidity ratio (grains of water per pound of air) calculated from cooling-air exiting temperature and relative humidity was higher than the cooling-air entering humidity ratio (grains of water per pound of air) calculated from cooling-air entering temperature and relative humidity, then the moisture previously retained in the VFD enclosure (QLAT) was assumed to have been re-evaporated into the cooling air (QTOT = QSENS + QLAT). If the cooling-air exiting humidity ratio was lower than the cooling-air entering humidity ratio, then the moisture was assumed to have migrated off the cooling air and gotten trapped in the VFD enclosure (QTOT = QSENS − QLAT). If there was no difference between cooling-air entering and exiting humidity ratio, then it was assumed there was no mass exchange in the VFD enclosure and no moisture was re-evaporated into the cooling air from the enclosure or dropped off the cooling air into the enclosure (QTOT = QSENS).
The third graph from the top in Figure 2 shows humidity-ratio differential between cooling air exiting and entering the enclosure. Figure 2 indicates that during the first part of the day, relative total cooling load was higher, varying from 35 percent to 100 percent, while entering cooling-air relative humidity varied from 32 percent to 45 percent. During this period, moisture that previously migrated into the VFD enclosure was re-evaporated (at a rate of +1.0 to +23.0 grains of water per pound of air) into the cooling air and carried away from the VFD enclosure. Later in the day, when VFD-enclosure relative total cooling load was lower (varying from 23 percent to 40 percent), either there was no moisture exchange or moisture dropped off from the cooling air into the VFD enclosure (at a rate of −1.0 to −4.3 grains of water per pound of air). During that time, entering VFD-enclosure cooling-air relative humidity was higher and close to 45 percent. The relative humidity of the air entering the VFD enclosure was always substantially higher (by about 20 percent to 25 percent) than the relative humidity of the air exiting the VFD enclosure. Lastly, the top graph in Figure 2 shows VFD-controller power-loss factor (PLF) varied from 1.9 kW to 8.3 kW, averaging 4 kW. This means that of the total amount of power going through the VFD during the day, approximately 4 kW was lost because of VFD-controller inefficiency. This 4 kW dissipated in the form of heat inside of the VFD enclosure. This also meant VFD operation incurred 96 kWh in additional daily electrical-energy use. At the maximum relative total daily VFD-enclosure cooling load of 100 percent (at 100-percent VFD speed, 90-kW electrical-motor input power, and 98.3-kW system input power), VFD electrical efficiency was conservatively estimated to be 91.5 percent. However, the overall VFD operational efficiency was estimated to be lower at 90.8 percent because of the additional electrical energy that was to be spent to remove heat dissipated into the VFD enclosure.
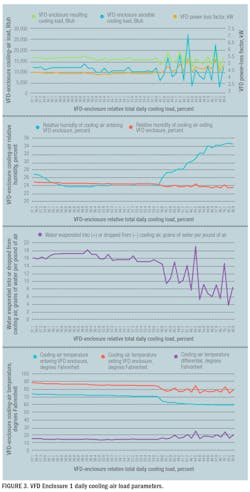
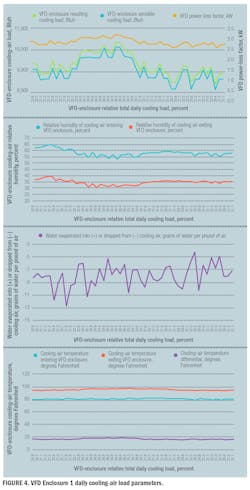
Figures 3 and 4 show daily cooling-air load parameters for VFD Enclosure 1. The mode of operation in Figure 3 also is shown in part in Figure 1 (Part 1 of article), in the space between Day 1 and Day 2. Figure 4 shows monitoring data not included in Figure 1.
The top graph in Figure 3 shows total (averaged for the day at 16,040 Btuh) and sensible (averaged for the day at 9,960 Btuh) daily cooling loads. Total cooling load constantly exceeded sensible cooling load. During the day shown in Figure 3, relative total daily cooling load varied from 40 percent to 85 percent, averaging near 56 percent, while relative humidity entering the VFD enclosure changed from 23 percent to 35 percent, averaging 27 percent (second graph from the top in Figure 3). The third graph from the top in Figure 3 indicates the moisture previously deposited in the VFD enclosure continually was re-evaporated from the VFD enclosure into the cooling air and carried outside of the enclosure. Moisture from the VFD enclosure was re-evaporated with a high evaporation rate (varied from about 4 to 19 grains of water per pound of air) into the cooling air. The cooling-air temperature differential (bottom graph in Figure 3) varied from 14.2°F to 24.3°F. Lastly, the top graph in Figure 3 outlines VFD PLF, which varied from 3.4 kW to 7.0 kW, with an average daily value of 4.7 kW. Thus, VFD operation caused nearly 113 kWh of additional electrical-energy use during the day.
The top graph in Figure 4 shows total (averaged for the day at 9,485 Btuh) and sensible (averaged for the day at 9,220 Btuh) VFD-enclosure daily cooling loads. During the day shown in Figure 4, the VFD-enclosure relative total daily cooling load varied from 30 percent to 36 percent, averaging 33 percent, while the relative humidity of cooling air entering the VFD enclosure varied from 53 percent to 65 percent (shown in the second graph from the top in Figure 4). This represents the highest value for the three-day period shown in figures 2-4, as well as for the 36-day period relative humidity was observed, averaging 59.7 percent. This value, however, still is significantly below the allowable relative humidity for cooling air (95 percent) suggested by VFD manufacturers. The moisture during this particular day was continually migrating inside of the VFD enclosure (the rate of migration varied from about -4.2 grains to -12.8 grains of water per pound of air). The cooling-air temperature differential (bottom graph in Figure 4) varied from 13.0°F to 15.5°F. Lastly, PLF during the day varied from 2.4 kW to about 3.0 kW, with an average daily value of 2.8 kW (top graph in Figure 4). Thus, VFD operation caused about 67 kWh of additional electrical-energy use over the course of the day.
Measures to eliminate moisture exchange in VFD enclosures represent a separate matter, which will be discussed in a future article.
125-hp VFD-controller design efficiency
Table 1 shows the performance of a 125-hp VFD controller at design conditions when various cooling systems were used to cool VFD Enclosure 1. The highest VFD efficiency of 91.5 percent was seen when once-through ventilation was applied to cool the enclosure. Using exhaust-fan power only, this cooling system typically is considered by VFD manufacturers. The lowest VFD efficiency of 88.8 percent was seen when VFD-enclosure cooling was provided from a central chilled-water plant consisting of water-cooled chillers, primary- and secondary-loop pumps, and air-handling units. When hybrid cooling consisting of once-through ventilation and mechanical cooling was applied, minimum VFD efficiency was 90 percent, dependent on the ratio of cooling provided from hybrid cooling.
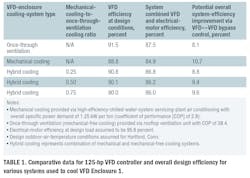
The application of VFD↔VFD-bypass control5 allowed for an increase in system overall efficiency of 8.1 percent to 10.7 percent, depending on the type of enclosure cooling system utilized.
Conclusions
A VFD computer system does not account for frequency-controller power losses and projects electrical-motor power demand and energy usage, excluding VFD-controller energy losses. This, along with the relatively low accuracy of VFD computer systems, which do not directly meter motor power demand, makes establishing the actual operational efficiency of VFDs within the range of motor variable loads difficult. The accuracy of VFD-system power-demand validation can be improved by monitoring VFD-enclosure cooling load.
Typically, electrical energy used for VFD-enclosure cooling is not considered, which can lead to overestimation of VFD efficiency. If a VFD enclosure is not cooled sufficiently and cooling-air conditions do not satisfy the requirements of the most sensitive element of a VFD—the computer system—the operational parameters, service life, and durability of the VFD control system could be negatively impacted.
The most reliable and consistent way to cool a VFD enclosure is to apply air conditioning. This will maintain the enclosure’s air humidity ratio and temperature at optimal operational conditions and help to prevent moisture from migrating inside of the enclosure. However, this also will reduce VFD operational efficiency. Because of that, VFD-enclosure cooling air conditioning typically is reserved for the most critical applications.
The monitoring of VFD-enclosure cooling load aids determination of actual VFD-controller PLF, as well as additional electrical-energy use, by converting heat dissipated into the enclosure to a kilowatt equivalent.
Monitoring of the sensible-cooling loads of two 125-hp VFDs conducted over a 35-day period indicates actual VFD efficiencies are lower than typically assumed in engineering calculations. Further monitoring of VFD enclosures should be conducted to verify actual VFD PLF and operational efficiencies.
VFD-enclosure total cooling load consists of sensible and latent components. Our investigation established a VFD’s total cooling load at design conditions could exceed its sensible load by as much as 49 percent. At higher VFD electrical loads and lower cooling-air entering relative humidities, moisture does not separate from cooling air and is carried out of the enclosure with the cooling air. However, at lower VFD electrical loads and higher cooling-air entering relative humidities, moisture migrates from the cooling air inside of the enclosure. This moisture gets removed from the enclosure during times of higher VFD electrical loads and lower entering relative humidities, when the heat generated inside of the enclosure is sufficient to re-evaporate moisture back into cooling air and carry it outside of the enclosure.
Our investigation indicates that at cooling-air entering relative humidities of 53 percent to 65 percent and temperature of 80°F at VFD-enclosure cooling loads of 30 percent to 35 percent, moisture from the cooling air continually accumulates in the enclosure.
Compared with constant-speed (VFD bypass) mode, application of variable speed for electrical motors leads to increased power demand during design and off-design conditions. Actual VFD efficiency could be substantially lower than the values projected by the manufacturer. In our investigation, VFD efficiency at design conditions was conservatively evaluated at 90.8 percent, 6.7 points lower than its design magnitude of 97.5 percent. Power demand for systems with VFD control could be optimized further by employing switchover control between VFD and VFD-bypass modes. This control strategy can reduce power demand during most critical operations at or near electrical peak-power conditions. The installation of an additional power-demand meter further enhances accuracy in substantiating energy savings.
In our investigation, power-demand reduction at design conditions with the suggested VFD↔VFD-bypass control was found capable of improving overall system efficiency by 8.1 percent to 10.7 percent. Moreover, in many instances, application of the strategy will enable customers to avoid interruption of operations when asked by the electrical utility to shed power demand.
Reference
5) Burd, A.L., & Burd, G.S. Optimized power demand control system for electrical motors. United States Patent No: US 8,143,819 B2. 8 claims. Date of patent March 27, 2012.
Alexander L. Burd, PhD, PE, is president of, and Galina S. Burd, MS, is a project manager for, Advanced Research Technology, an engineering and research consulting firm with offices in Suffield, Conn., and Green Bay, Wis. Alexander ([email protected]) has 35 years of experience in the design, research, and optimization of HVAC and district energy systems, which includes publication of more than 35 research and technical papers in American and European journals, while Galina ([email protected]) has more than 25 years of design and research experience in the HVAC and architectural-engineering field and has co-authored many technical and research papers in American journals. Alexander and Galina have co-authored three U.S. patents related to energy conservation.